This application uses a highly sophisticated, scientifically proven algorithm to measure and analyze the trembling of the hands, the so called tremor. It gives you the ability to measure and quantify your tremor and to keep track of your values.
The main goal of your measurements is to track your tremor and to compare it with previous recordings. Therefore, it is pre-requisite to standardize the measurement condition.
Introduction: Human Tremor
Tremor is the notion for the trembling of a limb. Most prominent is the trembling of the outstretched hand, that nearly everyone is aware of in special situations like excitement or strenuous workouts. Whereas a light trembling of the hand is present in all humans, increased amplitude of the trembling can lead to serious problems in daily life. Increased trembling could be a symptom of a wide variety of diseases.
StudyMyTremor gives you the ability to measure and track your trembling using highly sophisticated methods (see Section How does it Work).
For more information on human tremor, please refer to the information provided by the clinical community, for example:
Recording
There are 3 different recording sets:
- “Left hand outstretched”: To measure hand trembling of the left hand (as described below)
- “right hand outstretched”: To measure hand trembling of the right hand (as described below)
- “Free”: to measure trembling of other limbs, or trembling during motion etc.
To start a recording, choose the appropriate set. Stretch your hand, make sure your forearm is supported (see below), start counting backwards, and keep the hand as quiet as possible during the whole recording time. Press the Start button.
For most persons with physiological tremors or enhanced physiological tremors, the iPhone or iPod can be placed directly in the palm. Important: the forearm has to be supported, in the picture below simply by the table. The hand, however, is still able to move freely:

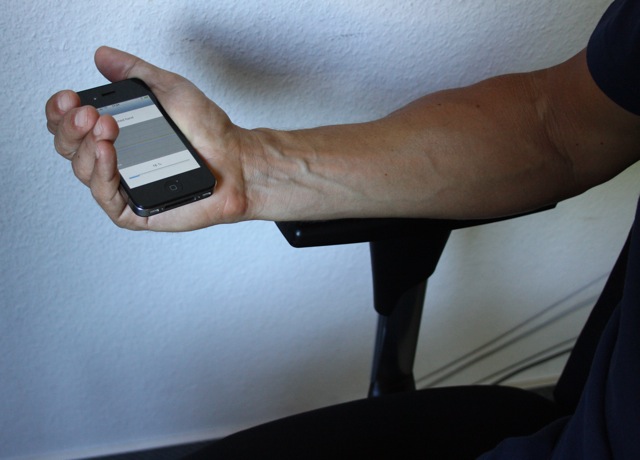
If your trembling is more severe, you should perform the recording on an armrest of a chair to make sure the hand can freely move around (which is not the case if you support the forearm by a table as shown above). In this case, you could hold the iPhone in place with your fingers as shown below:
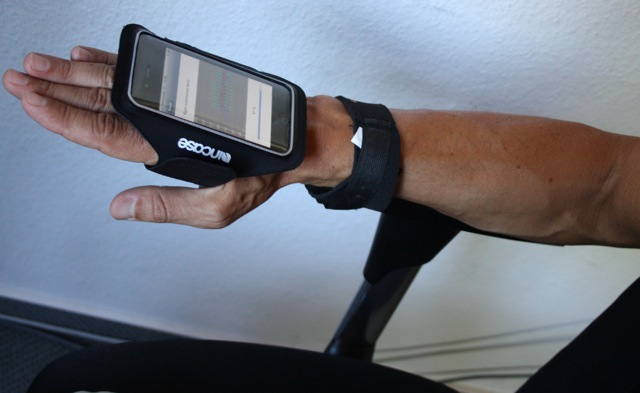
For very severe types of tremors (e.g., Parkinonian disease tremor), it may be necessary to use a case to fix the iPhone, as it is used for Sports. You can purchase the cases in every Apple store, or in many online stores. In addition, you could fix the forearm to the armrest by using a velcro band. The picture below illustrates how you get reliable measurements for severe tremors:
How does it work?
The iPhone is equipped with a sensitive, 3-dimensional sensor that measures acceleration. During the recording, the program is storing the acceleration of the iPhone. The measurements are then analyzed with a method that is described in detail in the following reference (and references therein):
A software for recording and analysis of human tremor
This App is giving users access to a method that has been available to highly specialized labs only for a very low price.
Results of the measurements and Saving
If the recording is finished your results are displayed in a color bar chart (see also Interpretation of the Charts). You will see the current measurement results as a marker labeled “New” within the color chart of all previous measurements stored in your iPhone or iPod. Below the bar the “Others” bracket mark the range of other users of the StudyMyHealth.com website.
If you want to keep the current measurement hit “Save”.
For “experts”: By hitting the “show details” field the spectrum of the single trial is displayed.
Note:
- If an error occurs telling you that there is no significant peak in your recording please repeat the recording and make sure your iPhone has been placed properly and that you hold your hand quiet during the recording. In very rare cases, especially when using older devices, it may be that your hand is too quiet to measure accurately. This is tha case when the amplitude is significantly below 0.1 mm
Interpretation of the Charts and Results
Calculated Values
The App is calculating a number of values based on the measured data:
- Frequency: This is the dominant frequency of your tremor, the unit is “Hertz” (Hz). For example, a value of 5 Hz means that your hand is oscillating approximately 5 times per second. For some types of pathological tremors this value is highly constant over time and does not vary. For the normal, physiological trembling of the hand the value varies with mechanical load, and other factors, and may be slightly different each measurement. Typical values are between 4 Hz and 10 Hz.
- Power: this value shows the Power (i.e. strength) of the tremor in the unit “milli Watt per kilogram mass of your hand”. Typical values for a normal, physiological hand tremor are between 1 and 3 mW, severe Tremors can reach values up to 10 or even 20 Watt (so 10.000 times the value of a normal tremor).
- Amplitude: this value corresponds to the Amplitude of the oscillation in Milli Meters if the recorded value would be a linear oscillator. For the normal, physiological tremor it is as low as 0.1 mm.
- Synchronization: This value is a measure of the “steepness” of the main peak in the tremor spectrum. The higher it is, the higher the likelihood that the tremor is of some pathological nature. Normal hand tremors are typically below 5, for pathological tremors this value can reach quickly values >100.
Color Bars
The graphs are showing your previous recordings color coded: green is marking your personal “normal” range, i.e. the range most of your previous measurements were in, whereas grey colors displays rather rare values (you might say “the less green the less values”).
You can switch between the result views by sliding horizontally.
Line charts
The line charts display the values of your measurements over time. The time range is chosen by the buttons below. In the line charts you can see how the values vary over time.
You can switch between the result views by sliding horizontally.
Trend charts
The trend chart is a smoothed version of the line chart. It is particularly useful to see if the values show a trend, i.e. if the get continously higher or lower. The trend chart is not shown if the chosen time range is displaying less than 5 days (note that, in this case, it does not make that much sense to look at a “trend”).
You can switch between the result views by sliding horizontally.
Single Spectrum
The interpretation of the single spectra requires some expert knowledge. In short, the line is the estimated frequency spectrum of your 3 dimensional recorded accelerometer data, projected to one single dimension. Main tremor frequency is the vertical red line; also all other values are derived from the spectrum.
You can watch the single spectrum of each recording in the calendar (see below).
Data management: The Calendar
Using the calendar you can manage the data on your iPhone or iPod, and display or delete single recordings. Days with recordings are marked with a dot. If you chose a day, the recordings you made that days are listed in the table below the calendar. To delete a single recording press on the recording. The single trial view is shown. By pressing the delete button in the upper right corner this data set will be deleted.
Export Data to iCloud Drive
Be part of a scientific world, and study your results! If you are using iCloud and have the iCloud Drive enabled on your device you can upload all results as ASCII File to your iCloud Drive. The files are stored in a folder called “StudyMyTremor”; single spectrum files are named after their creation date and time, and contain 2 columns. The first col is the frequency in Hertz, the second the power value. Values are separated by a semicolon.
The second file is called “All_Results.txt” and contains a table with all measurement results; also separated by semicolon. The first row contains the column headers.
You can import the text files to other programs, for example Microsoft(R) Excel(R), to analyze or visualize them.
Note: in earlier versions of the App we provided services based on a custom web App; this has been closed in August 2015. However, your local datastore is not affected by it, you can always export all recordings to iCloud as described above.